Posted Monday, 18 May 2026
Scitech takes science on the road in the Pilbara
Scitech will travel across the Pilbara, delivering hands-on science experiences to schools and communities.
Teachers learn how to integrate visual models like the bard model, number lines and area model into collaborative problem-solving lessons.
This year, veterans of the Powerful Problem-Solving (PPS) process have come together to learn to refine their approach through integrating additional concepts into their lessons. The Alcoa Powerful Problem-Solving Master Series is for teachers who have completed Alcoa Champions of Maths or Lighthouse Maths (supported by Chevron). The first assignment saw teachers undertaking 6 hours of intensive training in the use of visual models for number and calculation. Teachers deeply investigated how tools like the number line, bar model and area model could be used by students in strategies to solve problems, and by teachers to add clarity to student explanations and make connections between them. Students in PPS lessons work at stand-up whiteboards in groups. Lessons follow a 3-phase format where the task is introduced with minimal instruction (launch), students attack it in groups (explore), and then some groups are selected to present their solutions to the class in a whole class discussion, with the teacher facilitating (discuss). See previous blogs for more detail and examples of this approach. In this blog we will discuss examples of the implementation of visual models. Teachers used the visual models within PPS lessons as well as incorporating them into other instructional routines. This allowed multiple opportunities to help students make sense of the mathematics they were working on, to explain their thinking, and to reveal gaps in student understanding and overcome these gaps.
Connecting representations:
Federica used open number lines with her students to connect and expand on their understanding of 4-digit numbers. Students were given the number 1342 and asked to represent it in different ways. Most students first went to representing by partitioning the place value:
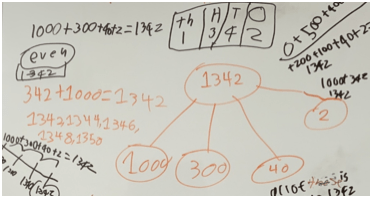
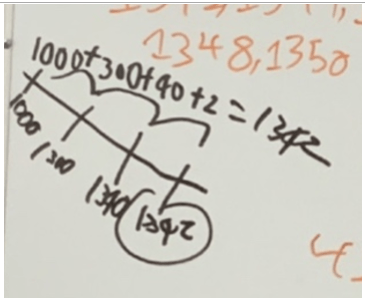
Federica then prompted students to use an open number line to represent the amount (explaining the process when necessary) which allowed them to visualise how the different parts (100, 300, 40 and 2) add together to make the final number:
Identifying gaps in knowledge
Katrina focused on the use of the bar model and the part-part-whole relationship as students were focusing on addition and subtraction strategies, and the school had identified that they were having a particular difficulty in interpreting word problems involving addition and subtraction. She familiarised students with using a graphic organiser to identify the parts and whole in a problem and the relationships between them. For example, she gave the students the following problem:
Mary was in the hospital and she got 403 get well cards from around the country. When she got home she got 287 more cards from friends and family. How many get well cards did Mary get?
And the following graphic organiser to help solve it:
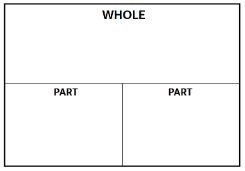
403 and 287 are parts that add together to make the whole of 690.
Whereas in a problem like:
Tom’s house is 560m from the school. The shops are 320m from Tom’s house, along the way to school. How far is it from the shops to the school?
Here, the 320m is a part, 560m is the whole, and the other part (distance from the shops to school) is missing. So, the distance from the shops to the school is 560m – 320m = 240m.
Use of this model, at first showed that students had a lot of difficulty correctly identifying the parts and the whole. Persistent use of the model enabled them to better identify these and understand the relationship between them. This is empowering students to be more effective in solving word problems involving addition and subtraction.
Building the toolkit through explicit teaching
Lene spent time with her class, explicitly teaching the use of an open number line before giving them the “Four on a Bench” problem to solve. She had given this problem to her class last year, but had not trained them in the use of an open number line. The “Four on a Bench” problem is:
There are four men sitting on a bench: Tom, Steve, Clinton and Greg.
Tom is 78 years old.
Clinton is going to have his 80th birthday next year.
Steve had his 70th birthday six years ago.
Greg is 5 years older than Steve.
How old is each man? Put them in order from youngest to oldest.
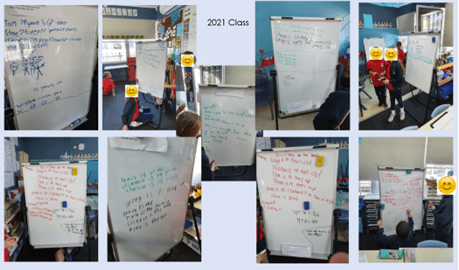
Solutions from 2021 class (not taught the use of an open number line):
Solutions from 2022 class (preceded by explicit teaching of open number line):
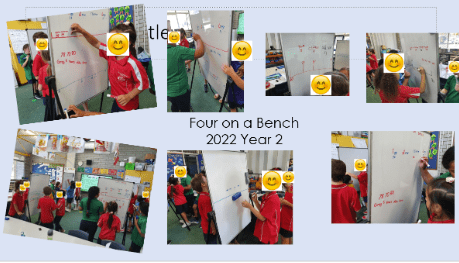
As you can see from the photographs, all students in the 2022 class made use of an open number line in forming their solution. The use of the number line in their solutions enabled every student to contribute to the discussion and provide reasoning behind their answers, as they were able to see the relationship between the different ages of the men. The explicit teaching of using an open number line in multiple contexts made this a “go-to” strategy and part of the students’ problem-solving toolkit, which meant they were able to quickly identify this problem as an appropriate situation to apply the use of an open number line.
Unpacking reasoning and overcoming a mistake:
Lisa used the bar model in a discussion of a problem to help a student overcome their misunderstanding. Students were discussing their solution to the following problem:
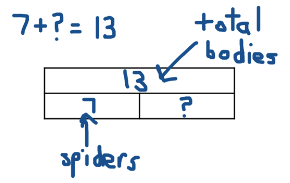
At the zoo, one display shoed several spiders and snakes. Mathew counted 56 legs and 13 bodies in the display. How many spiders and snakes were there?
A student incorrectly concluded that there were 20 snakes by adding 13 to 7. Lisa then used the bar model and a sequence of questions to unpack the reasoning and identify and overcome the mistake.
Lisa: How many bodies were there in total?
Student: 13.
What does the 7 represent?
Student: Spiders.
Lisa: How do you know there are 7 spiders?
Student: Because 7 x 8 = 56 and there are 56 legs.
Lisa: What other animals are there?
Student: Snakes.
After this discussion, unpacking the thinking using the bar model, the student later commented:
“The thing I kinda asked is why did you do 13 + 7 = 20 because I’m kind of confused how it is because there’s only 13 bodies altogether. So, when I was on the mat I used my working out. I did 7 + 6 = 13. The body is 13. And for the legs 8 x 7 so 7 represents the spiders and 6 represents snakes.”
Sequencing visual models to build multiplication strategies
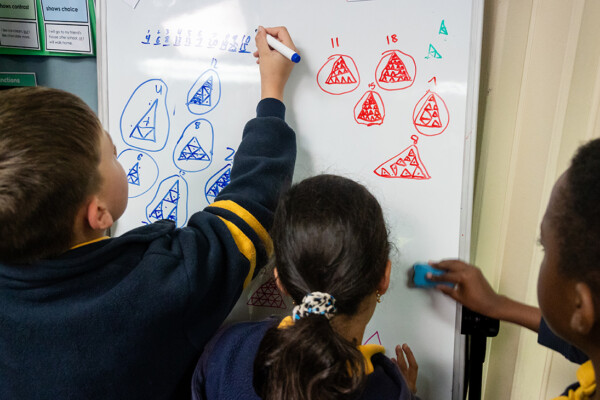
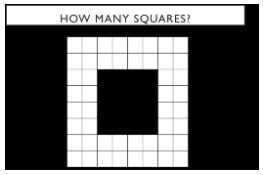
Karl took his class through a sequence of exposures to build up students’ ability to use the area model to simplify multiplications. He began with dot talks, asking students to say how many the saw, and how they saw it.

Some possible answers:
2 groups of 3 (diagonals) and a 1.
6 (the big upside down triangle) and 1.
A row of 3, a row of 2, and another row of 2.
And many more…
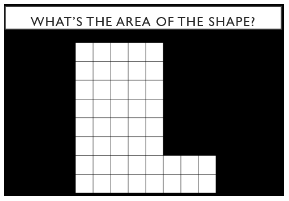
This began to get students used to the idea of seeing the amounts in chunks and that there were different ways to see it. Next Karl used arrays with composite shapes to think about breaking into multiplications. E.g.

7 x 5 + 3 x 2 = 35 + 6= 41
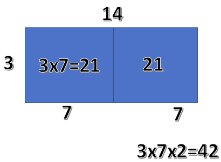
And connecting multiplication and area:
Finally students were encouraged to work in the opposite direction, decomposing numbers into their parts in order make a multiplication more manageable (by breaking up the rectangle). This can be seen in the following examples of students solutions. You can also see how students are starting to extend the idea to use a range of other related strategies:
Karl has begun to see a whole range of strategies emerging:
In response to the assignment, incorporated the use of visual models into their lessons in a range of ways that made their students learning more effective. Federica used open number lines to help students connect to different representations and better understand the structure of place value. Katrina used the bar model to uncover and address students’ difficulty in solving addition and subtraction word problems. Lene explicitly taught the use of open number lines in preparation for a problem where they could be applied, and hence empowered much more success in solving the problem and richer, more focussed discussions between students. Lisa made use of the model to help guide a student to unpack and correct their thinking. And finally, Karl sequenced several visual models to facilitate student access to a range of strategies for mental multiplication. The examples here show the power and utility of visual models in mathematics instruction, especially when combined with a problem-solving approach focussed on student discussion and reasoning.
If you want to follow the blog, you can join the Facebook group for updates.
Wishing you all increasing success in your maths lessons!
Federica, Katrina, Lene, Lisa, Karl and Shyam.
Authors are participants of Lighthouse Maths, proudly supported by Chevron.
Scitech is a not-for-profit organisation proudly supported by the Western Australian Government through the Department of Energy and Economic Diversification

Upon clicking the "Book Now" or "Buy Gift Card" buttons a new window will open prompting contact information and payment details.